Getting Results#
For all example code in this page, ospgrillage is imported as og
import ospgrillage as og
Extracting results#
After analysis, results are obtained using get_results() function.
The following example extracts results for all defined analysis of example_bridge - all results and one of a specific load case only.
all_result = example_bridge.get_results() # this extracts all results
patch_result = example_bridge.get_results(load_case = "patch load case") # this extracts only the patch load case results
The returned result variable is an xarray DataSet.
The following is printed to terminal after printing all_result:
<xarray.Dataset>
Dimensions:        (Component: 18, Element: 142, Loadcase: 5, Node: 77, Nodes: 2)
Coordinates:
  * Component      (Component) <U7 'Mx_i' 'Mx_j' 'My_i' ... 'theta_y' 'theta_z'
  * Loadcase       (Loadcase) <U55 'Barrier' ... 'single_moving_point at glob...
  * Node           (Node) int32 1 2 3 4 5 6 7 8 9 ... 69 70 71 72 73 74 75 76 77
  * Element        (Element) int32 1 2 3 4 5 6 7 ... 136 137 138 139 140 141 142
  * Nodes          (Nodes) <U1 'i' 'j'
Data variables:
    displacements  (Loadcase, Node, Component) float64 nan nan ... -4.996e-10
    forces         (Loadcase, Element, Component) float64 36.18 -156.9 ... nan
    ele_nodes      (Element, Nodes) int32 2 3 1 2 1 3 4 ... 32 75 33 76 34 77 35
Structure of xarray DataSet#
Figure 1 shows the structure of the xarray DataSet for results. The dataset contains two xarray DataArray. that represent two groups of load effects:
displacements i.e. rotation and translations
forces e.g. bending about z axis, Shear forces etc.
Following example extracts the displacements and forces DataArray from DataSet:
disp_array = all_result.displacements # displacement components
force_array = all_result.forces # force components
The third variable ele_nodes of the DataSet (Figure 1) contains information for element and its respective nodes.
ele_array = all_result.ele_nodes # store variable array as ele_array
The forces DataArray is grouped according to element types. Depending on ModelTemplates, there can be one or more types of elements in the grillage model. For example, force of a Shell & Beam Elements - shell_beam are recorded in two separate DataArrays, namely forces_beam and forces_shell respectively (Figure 1). Similarly, ele_nodes will be split into ele_nodes_beam and ele_nodes_shell.
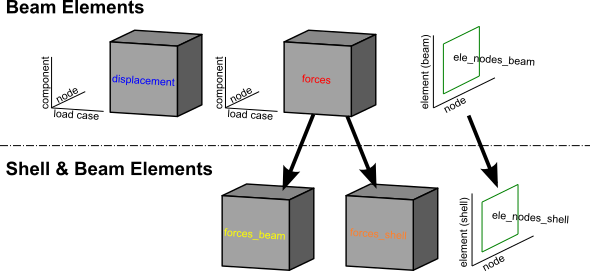
Figure 1: Structure of DataSet.#
Accessing and querying data#
From the data arrays, users can access various component in each load effect using xarray’s data array commands. Information on indexing and selecting DataArray data can be found here
Following example extracts the displacement ‘dy’ component using xarray’s function.
disp_array.sel(Component='dy') # selecting "dy" component
force_array.sel(Component='Mz_i') # selecting "Mz_i" component
Following example shows how to extract results for specific load cases of specific element/node:
disp_array.sel(Loadcase="patch load case",Node=20)
force_array.sel(Loadcase="Barrier", Element=[2,3,4])
If the load case is part of a Moving load i.e. an incremental load cases, there are several ways to lookup the respective incremental load case. Following example shows the various method of xarray to extract and select force data:
by_name = force_array.sel(Loadcase="patch load case at global position [0,0,0]") # by load case name
by_index = force_array.isel(Loadcase = 0)  # by indexing
Note
For moving load, the nomenclature of incremental load cases are generated automatically by ospgrillage, with load case name followed by “at global position [x,y,z]” where x, y , z are the positions of the moving load/ compound load with respect to the global grillage coordinate.
Getting combinations#
Load combinations are computed on the fly in get_results() by specifying a keyword argument for combinations.
The keyword argument accepts a dict with load case name strings as key, and corresponding load factor as value.
The returned DataArray will have load case multiplied by prescribed load factors and summed along the load case dimension (for each load case in load combination).
The following example code defines a load combinations which comprise of two load cases.
# create dict with load case name string as key, and load factor as value
comb_dict = {"patch_load_case":2,"moving_truck":1.6}
comb_result = example_bridge.get_results(combinations=comb_dict)
# print combination
print(comb_results)
The following is printed to the terminal.
<xarray.Dataset>
Dimensions:        (Component: 18, Element: 142, Loadcase: 3, Node: 77, Nodes: 2)
Coordinates:
  * Component      (Component) <U7 'Mx_i' 'Mx_j' 'My_i' ... 'theta_y' 'theta_z'
  * Node           (Node) int32 1 2 3 4 5 6 7 8 9 ... 69 70 71 72 73 74 75 76 77
  * Element        (Element) int32 1 2 3 4 5 6 7 ... 136 137 138 139 140 141 142
  * Nodes          (Nodes) <U1 'i' 'j'
  * Loadcase       (Loadcase) <U55 'moving_truck at global position [2...'
Data variables:
    displacements  (Loadcase, Node, Component) float64 nan nan ... 0.0 7.688e-05
    forces         (Loadcase, Element, Component) float64 36.18 -156.9 ... nan
    ele_nodes      (Loadcase, Element, Nodes) int32 6 9 3 6 ... 228 102 231 105
For combinations pertaining static and moving load cases, the factored static load cases are added to each incremental load case of the moving load.
Getting load envelope#
Load envelope is generated from load combination results for extrema of load effect using create_envelope() function.
Envelope are chosen based on user selected component (array keyword) as either “displacements” or “forces”, extrema as either maximum or minimum,
and load effect component (e.g. “dy” for displacements).
The following example uses creates a Envelope object and uses its class function to get() the enveloped DataArray:
envelope = og.create_envelope(ds=comb_results,load_effect="dy",array="displacements") # creates the envelope obj
disp_env = envelope.get() # output the created envelope of xarray
By default, Envelope is in query mode whereby the load case corresponding to the maxima
are returned.
The following is printed to the terminal when disp_env is printed:
<xarray.DataArray 'Loadcase' (Node: 77, Component: 18)>
array([[nan, nan, nan, ...,
        'single_moving_point at global position [2.00,0.00,2.00]',
        'single_moving_point at global position [2.00,0.00,2.00]',
        'single_moving_point at global position [4.00,0.00,3.00]'],
       ...,
       [nan, nan, nan, ...,
        'single_moving_point at global position [3.00,0.00,2.50]',
        'single_moving_point at global position [2.00,0.00,2.00]',
        'single_moving_point at global position [3.00,0.00,2.50]']],
      dtype=object)
Coordinates:
  * Component  (Component) <U7 'Mx_i' 'Mx_j' 'My_i' ... 'theta_y' 'theta_z'
  * Node       (Node) int32 1 2 3 4 5 6 7 8 9 10 ... 69 70 71 72 73 74 75 76 77
One can read the coordinates to understand the valid load_effect kwargs.
The following example prints the array of coordinates:
max_disp.coords['Components'].values
The following is returned and printed to terminal.
array(['Mx_i', 'Mx_j', 'My_i', 'My_j', 'Mz_i', 'Mz_j', 'Vx_i', 'Vx_j',
   'Vy_i', 'Vy_j', 'Vz_i', 'Vz_j', 'dx', 'dy', 'dz', 'theta_x',
   'theta_y', 'theta_z'], dtype='<U7')
For more information on the inputs and options, see create_envelope().
Getting specific properties of model#
Node#
- OspGrillage.get_nodes()
Function to return all information for nodes in grillage model
- Returns:
dict contain node information
Element#
- OspGrillage.get_element()
Function to query properties of elements in grillage model.
- Keyword:
options (`str): string for element data option. Either “elements” or “nodes” (default)
- z_group_num (int): group number [0 to N] for N is the number of groups within a specific grillage element group.
this is needed for interior beams, where users which to query specific group (e.g. 2nd group) within this “interior_main_beam” element group.
x_group_num (int): ditto for z_group_num but for x_group
edge_group_num(int): ditto for z_group_num but for edge groups
- Returns:
List of element data (tag)
Plotting results of DataArrays#
Current limitation of OpenSees visualization module#
OpenSeesPy’s visualization module - ops_vis - offers comprehensive visualization analysis results in OpenSees.
However, ops_vis operates only for a single model instance (and analysis) in OpenSees
framework.
In other words, results from xarray DataSet (of get_results()) cannot be plotted using the current visualization module.
Additionally, ops_vis does not contain enveloping feature across multiple analysis - especially for moving load analysis comprise of multiple incremental load case for each moving load position.
If needed, users can still utilize ops_vis however only in a specific condition i.e. only a single load case is defined and analyze() in the OpenSees framework.
With only a single load case and analysis, users can directly access the model results and plot using ops_vis.
The following code example plots the results of the current analysis instance using ops_vis:
og.opsv.section_force_diagram_3d('Mz', {}, 1) # here change name string argument to force component of interest
Note
opsv only works for model template 1 (beam grillage) and 2 (beam grillage with rigid links). Plotting of shell model type is not supported as of ospgrillage version 0.1.0
ospgrillage post-processing module#
For users wishing to plot results from xarray DataSet (multiple analysis), ospgrillage contains a dedicated post-processing module as of version 0.1.0 to visualize these results.
Note
The plotting functions of post-processing module is at alpha development stage as compared to other modules. As of version 0.1.0, it is sufficient to plot components from the xarray DataSets.
Plotting functions#
For this section, we will refer to an exemplar 28 m super-T bridge (Figure 1).
The bridge grillage has been created and its OspGrillage object is defined as bridge_28.

Figure 1: 28 m super-T bridge model.#
To plot deflection components from displacement DataArray, use plot_defo().
To use this function users need to specify the specific grillage member - this function returns a 2-D plot of displacement diagram.
Following example plots the vertical deflection of bridge_28, for “exterior_main_beam_2” member - plot shown in Figure 2:
og.plot_defo(bridge_28, results, member="exterior_main_beam_2", option= "nodes")

Figure 2: Deflected shape of of exterior main beam 2.#
To plot force components from forces DataArray, use plot_force().
Similar to plot_defo(), users need to specify name string of specific grillage member.
Following example plots the bending moment “Mz” of “exterior_main_beam_2” in bridge_28 - plot shown in Figure 3:
og.plot_force(bridge_28, results, member="exterior_main_beam_2", component="Mz")
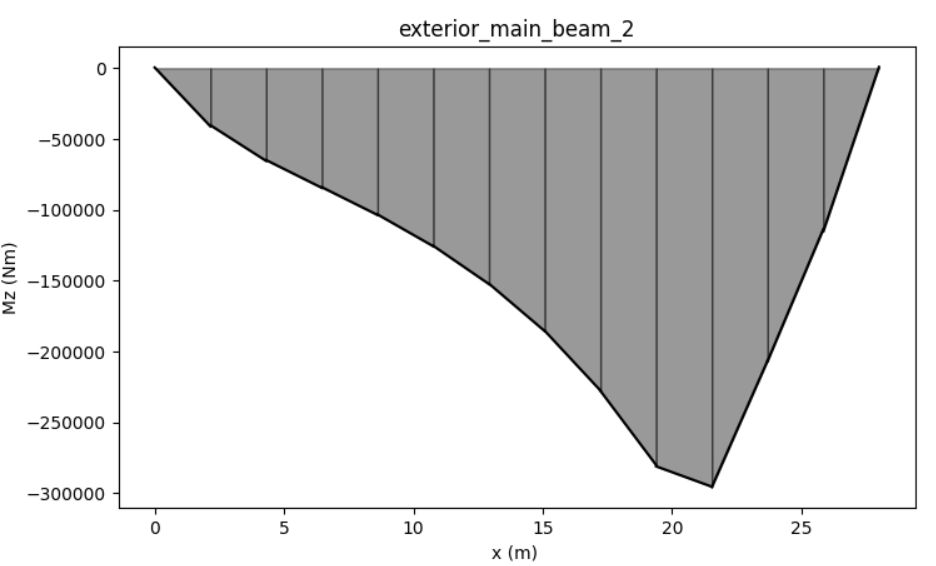
Figure 3: Bending moment about z axis of exterior main beam 2 .#