
Influence Lines and Surfaces#
This notebook demonstrates the recommended influence-analysis workflow in ospgrillage:
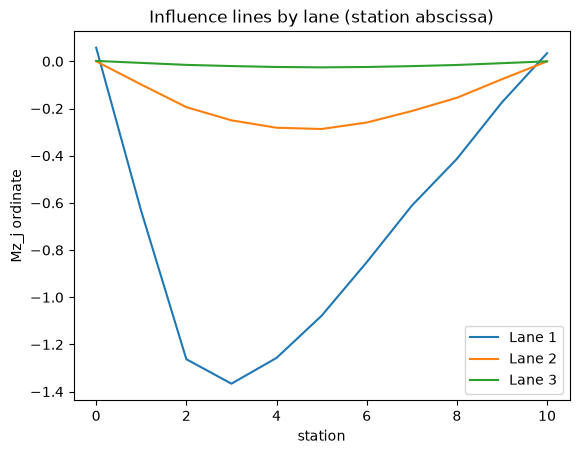
multi-lane influence lines in one result object/file,
2D and path-overlay influence-line plotting,
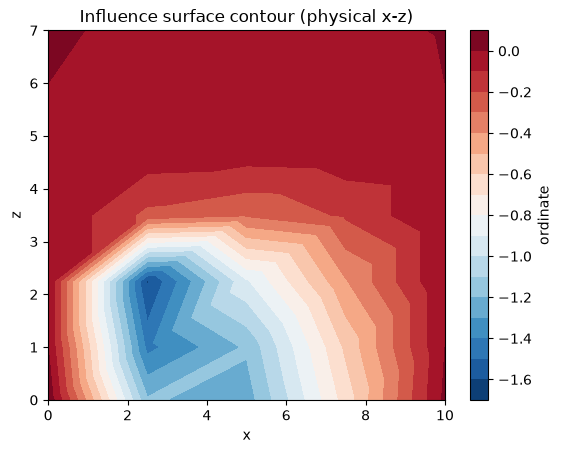
station-based influence-surface extraction,
physical-coordinate influence-surface plotting for skewed/curved geometry,
semantic NetCDF output naming (
.il.nc/.is.nc) and CSV export.
[1]:
import sys
from pathlib import Path

cwd = Path.cwd().resolve()
for candidate in [cwd, *cwd.parents]:
    src_dir = candidate / "src"
    if (src_dir / "ospgrillage").exists():
        sys.path.insert(0, str(src_dir))
        break

import ospgrillage as og

try:
    import plotly.io as pio
    pio.renderers.default = "notebook_connected"
except Exception:
    pass
Technical context#
shape_function="hermite"uses Hermite interpolation on quadrilateral regions and a DKT-style condensed triangular distributor on 3-node skew regions.Influence lines often use
load_coord="station"because station is a stable abscissa along a lane path even when the bridge is skewed/curved.Influence surfaces are built from admissible mesh station points and retain mapped physical (
x,z) coordinates for plotting/export.
Build a compact bridge model#
[2]:
concrete = og.create_material(material="concrete", code="AS5100-2017", grade="50MPa")
main_section = og.create_section(A=0.896, J=0.133, Iy=0.213, Iz=0.259, Ay=0.233, Az=0.58)
slab_section = og.create_section(A=0.04428, J=2.6e-4, Iy=1.1e-4, Iz=2.42e-4, Ay=3.69e-1, Az=3.69e-1, unit_width=True)
edge_section = og.create_section(A=0.044625, J=2.28e-3, Iy=2.23e-1, Iz=1.2e-3, Ay=3.72e-2, Az=3.72e-2)

main_beam = og.create_member(member_name="Main Beam", section=main_section, material=concrete)
slab = og.create_member(member_name="Slab", section=slab_section, material=concrete)
edge_beam = og.create_member(member_name="Edge Beam", section=edge_section, material=concrete)

bridge = og.create_grillage(
    bridge_name="Influence Demo",
    long_dim=10,
    width=7,
    skew=0,
    num_long_grid=7,
    num_trans_grid=5,
    edge_beam_dist=1,
    mesh_type="Ortho",
)
bridge.set_member(main_beam, member="interior_main_beam")
bridge.set_member(edge_beam, member="exterior_main_beam_1")
bridge.set_member(edge_beam, member="exterior_main_beam_2")
bridge.set_member(edge_beam, member="edge_beam")
bridge.set_member(slab, member="transverse_slab")
bridge.set_member(edge_beam, member="start_edge")
bridge.set_member(edge_beam, member="end_edge")
bridge.create_osp_model(pyfile=False)

target_element = bridge.get_element(member="interior_main_beam", options="elements")[0];
Material library unable to be read; using default library
Influence lines from multiple lane paths#
[3]:
paths = {
    "Lane 1": og.Path(start_point=og.Point(0, 0, 1.5), end_point=og.Point(10, 0, 1.5), increments=11),
    "Lane 2": og.Path(start_point=og.Point(0, 0, 3.5), end_point=og.Point(10, 0, 3.5), increments=11),
    "Lane 3": og.Path(start_point=og.Point(0, 0, 5.5), end_point=og.Point(10, 0, 5.5), increments=11),
}

ils = bridge.analyze_influence_lines(
    paths=paths,
    axle_load=1.0,
    shape_function="hermite",
);
[4]:
ils.plot(
    array="forces",
    component="Mz_j",
    element=target_element,
    load_coord="station",
    title="Influence lines by lane (station abscissa)",
    ylabel="Mz_j ordinate",
);
[5]:
fig_il_path = ils.plot(
    array="forces",
    component="Mz_j",
    element=target_element,
    backend="plotly",
    view="path",
    load_coord="station",
    title="Influence lines overlaid on axle paths",
    show=False,
);
# Optional in an interactive notebook frontend:
# fig_il_path.show()
---------------------------------------------------------------------------
ModuleNotFoundError                       Traceback (most recent call last)
File ~/work/ospgrillage/ospgrillage/src/ospgrillage/postprocessing.py:207, in _import_plotly()
    206 try:
--> 207     import plotly.graph_objects as go
    209     return go

ModuleNotFoundError: No module named 'plotly'

During handling of the above exception, another exception occurred:

ImportError                               Traceback (most recent call last)
Cell In[5], line 1
----> 1 fig_il_path = ils.plot(
      2     array="forces",
      3     component="Mz_j",
      4     element=target_element,

File ~/work/ospgrillage/ospgrillage/src/ospgrillage/osp_grillage.py:385, in InfluenceLineResults.plot(self, **kwargs)
    383 plot_kwargs = dict(kwargs)
    384 plot_kwargs.setdefault("dataset", self.dataset)
--> 385 return plot_influence_line(self.get_line(**kwargs), **plot_kwargs)

File ~/work/ospgrillage/ospgrillage/src/ospgrillage/postprocessing.py:940, in plot_il(il, **kwargs)
    938 if backend != "plotly":
    939     raise ValueError("plot_il(view='path') currently requires backend='plotly'")
--> 940 fig = _plot_il_path_plotly(lines, **kwargs)
    941 if title is not None:
    942     fig.update_layout(title=title)

File ~/work/ospgrillage/ospgrillage/src/ospgrillage/postprocessing.py:667, in _plot_il_path_plotly(lines, **kwargs)
    665 def _plot_il_path_plotly(lines, **kwargs):
    666     """Plot one or more influence lines along their load paths on the bridge model."""
--> 667     go = _import_plotly()
    668     dataset = kwargs.get("dataset", None)
    669     if dataset is None:

File ~/work/ospgrillage/ospgrillage/src/ospgrillage/postprocessing.py:211, in _import_plotly()
    209     return go
    210 except ImportError:
--> 211     raise ImportError(
    212         "plotly is required for interactive plots. "
    213         "Install it with: pip install ospgrillage[gui]"
    214     )

ImportError: plotly is required for interactive plots. Install it with: pip install ospgrillage[gui]
Influence surface from admissible station grid#
[6]:
iss = bridge.analyze_influence_surfaces(
    name="Deck IS",
    point_load=1.0,
    shape_function="hermite",
);
[7]:
iss.plot(
    array="forces",
    component="Mz_j",
    element=target_element,
    x_coord="longitudinal_station",
    y_coord="transverse_station",
    coordinate_space="physical",
    title="Influence surface contour (physical x-z)",
);
[8]:
fig_is_3d = iss.plot(
    array="forces",
    component="Mz_j",
    element=target_element,
    x_coord="longitudinal_station",
    y_coord="transverse_station",
    coordinate_space="physical",
    backend="plotly",
    view="surface3d",
    title="Influence surface mapped to physical deck coordinates",
    show=False,
);
# Optional in an interactive notebook frontend:
# fig_is_3d.show()
---------------------------------------------------------------------------
ModuleNotFoundError                       Traceback (most recent call last)
Cell In[8], line 1
----> 1 fig_is_3d = iss.plot(
      2     array="forces",
      3     component="Mz_j",
      4     element=target_element,

File ~/work/ospgrillage/ospgrillage/src/ospgrillage/osp_grillage.py:469, in InfluenceSurfaceResults.plot(self, **kwargs)
    467 def plot(self, **kwargs):
    468     """Reduce and plot one influence surface."""
--> 469     return plot_influence_surface(self.get_surface(**kwargs), **kwargs)

File ~/work/ospgrillage/ospgrillage/src/ospgrillage/postprocessing.py:1203, in plot_is(isurface, **kwargs)
   1200     return ax
   1202 if backend == "plotly":
-> 1203     import plotly.graph_objects as go
   1205     fig = kwargs.get("ax", None)
   1206     has_existing_traces = fig is not None and len(getattr(fig, "data", ())) > 0

ModuleNotFoundError: No module named 'plotly'
Curved Deck Example#
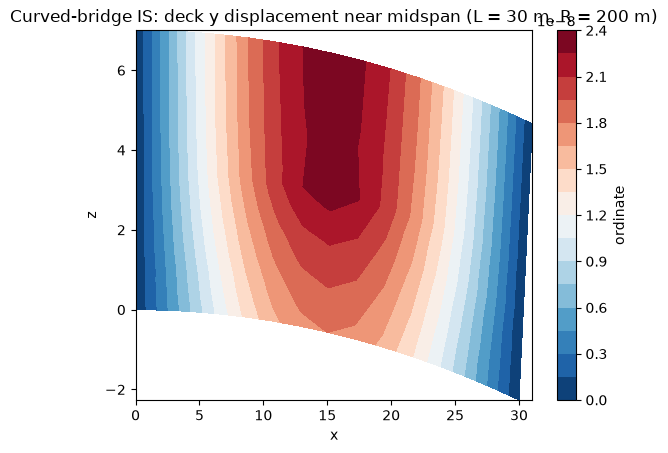
Curved meshes follow the same API as the dedicated curve_mesh notebook. The compact check below uses a moderate highway-style curvature (long_dim=30, mesh_radius=200) and plots the influence surface in physical x-z space.
[9]:
curved_bridge = og.create_grillage(
    bridge_name="Curved Influence Demo",
    long_dim=30,
    width=7,
    skew=0,
    num_long_grid=7,
    num_trans_grid=15,
    edge_beam_dist=1,
    mesh_type="Ortho",
    mesh_radius=200,
)
curved_bridge.set_member(main_beam, member="interior_main_beam")
curved_bridge.set_member(edge_beam, member="exterior_main_beam_1")
curved_bridge.set_member(edge_beam, member="exterior_main_beam_2")
curved_bridge.set_member(edge_beam, member="edge_beam")
curved_bridge.set_member(slab, member="transverse_slab")
curved_bridge.set_member(edge_beam, member="start_edge")
curved_bridge.set_member(edge_beam, member="end_edge")
curved_bridge.create_osp_model(pyfile=False)

curved_nodes = curved_bridge.get_nodes()
curved_target_node = min(
    curved_nodes,
    key=lambda tag: (
        (curved_nodes[tag]["coordinate"][0] - 15.0) ** 2
        + (curved_nodes[tag]["coordinate"][2] - 3.5) ** 2
    ),
)
curved_iss = curved_bridge.analyze_influence_surfaces(
    name="Curved Deck IS",
    point_load=1.0,
    shape_function="hermite",
);
ax_curved = curved_iss.plot(
    array="displacements",
    component="y",
    node=curved_target_node,
    x_coord="longitudinal_station",
    y_coord="transverse_station",
    coordinate_space="physical",
    title="Curved-bridge IS: deck y displacement near midspan (L = 30 m, R = 200 m)",
);
ax_curved.set_aspect("equal", adjustable="box");
Save combined influence outputs#
Both result objects retain save metadata and can be written directly to single NetCDF files. If a stem is given, semantic suffixes are applied: *.il.nc for influence lines and *.is.nc for influence surfaces.
[10]:
il_nc = ils.save("lane_ils")
is_nc = iss.save("deck_is")
print(f"Saved {il_nc}")
print(f"Saved {is_nc}")
Saved lane_ils.il.nc
Saved deck_is.is.nc
Export CSV#
IL CSV is long-form with one row per path station.
IS CSV can be exported as station-grid (
layout="grid") and optional companion point map with physical coordinates.
[11]:
il_csv = ils.to_csv(
    "lane_ils.csv",
    array="forces",
    component="Mz_j",
    element=target_element,
    load_coord="station",
)

is_csv = iss.to_csv(
    "deck_is_grid.csv",
    array="forces",
    component="Mz_j",
    element=target_element,
    include_physical_coords=True,
)

print(f"Saved {il_csv}")
print(f"Saved {is_csv}")
Saved lane_ils.csv
Saved {'grid': 'deck_is_grid.csv', 'points': 'deck_is_grid_points.csv'}